
Budget speech 2017: Budgeting at the heigh of inequality
22 February 2017
The current political crisis in South Africa, with national Treasury at its epicentre, sees certain political actors hell bent on reversing the gains made in the schooling system. It should not deter us from working towards an equitable basic education sector. Those wanting to capture national Treasury for personal gains have no interest in working toward serving the people of this country, particularly the black poor and working class.
Equal Education hereby calls on the hard working and dedicated staff of national Treasury to turn their attention to the crisis in rural education in South Africa, and the ways in which the current funding regime systemically underfunds rural education.
The manner in which South Africa’s basic education system is funded serves to perpetuate inequality - adversely impacting learners in rural classrooms. As Finance Minister Pravin Gordhan today tables his budget speech, Equal Education (EE) must register its serious concern with how provincial education budgets are determined, and with the steady decrease in allocations to grants specifically targeted at providing an environment conducive to quality teaching and learning. There is a pressing need for Treasury to review its education funding model.
From the National Fiscus, to Provinces
The amounts allocated to individual provinces from national Treasury are determined through the provincial equitable share formula. This allocates a lump sum to each province according to specific criteria. The formula consists of six components, which are intended to consider variations in contextual factors and service delivery demands between provinces:

- Education component (48% of the formula): based on the size of the school-age population (ages 5 to 17) and the number of learners enrolled in public schools
- Health component (27%): based on each province’s health needs
- Basic component (16%): derived from each province’s share of the national population
- Institutional component (5%): divided equally between provinces
- Poverty component (3%): calculated based on income data
- The percentages allocated to education and health take into account what part of the provincial allocation has historically been spent on these sectors (IE. spending patterns over a number of years).
The equitable share formula described here only serves to calculate each province’s share of the overall provincial allocation. It is not prescriptive on how that share must be spent by the province. It is then up to each province to decide how to divide its lump sum between the different provincial social services (education, health, welfare, housing, community development).
The percentages set out above do not represent a breakdown of each individual province’s allocation. Rather, they reflect how the entire equitable share lump sum is divided up into components. From each of these components individual provinces will then receive a share based on their specific context. That is, the 48% for education will be further divided up between the nine provinces depending on their school-age population and how many enrolled learners they have.
Calculation of Education Component of Equitable Share
The education component is calculated in two phases. The first step is to calculate 48% of the entire amount allocated to provincial governments. In the 2016/17 budget the education component amounted to R197.1 billion of the entire provincial allocation of R410.7 billion. The second step is to calculate how much of this education component is allocated to each province. This is calculated based on each province’s share of the national school age population (children aged 5 to 17) and its share of South African learners enrolled from Grade R to Grade 12. If, for instance, a province’s school age population makes up 16% of the national school age population and its enrolled learners make up 16.4% of all learners enrolled in public schools nationally, the province will get 16.2% of the total education component (which in turn is 48% of the total equitable share). The 16.2% is calculated by adding 16% and 16.4% and dividing it by two.[2]
Because equitable shares are calculated based on provinces’ unique contexts, the composition of each province’s share looks different. For instance, in the 2016/17 budget year the education component contributed 53% of Limpopo’s equitabe share, but 41.7% of the Northern Cape’s[3]:
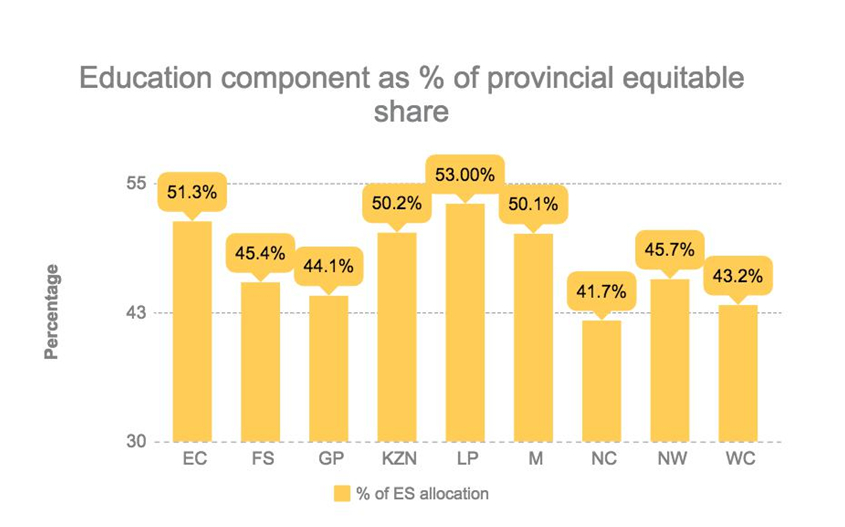
Source: W1 Annexure to the Explanatory memorandum to the division of revenue, 2016
However, because provinces have the prerogative to decide how to spend their equitable share, they are not compelled to spend the entire amount they get from the education component on education:
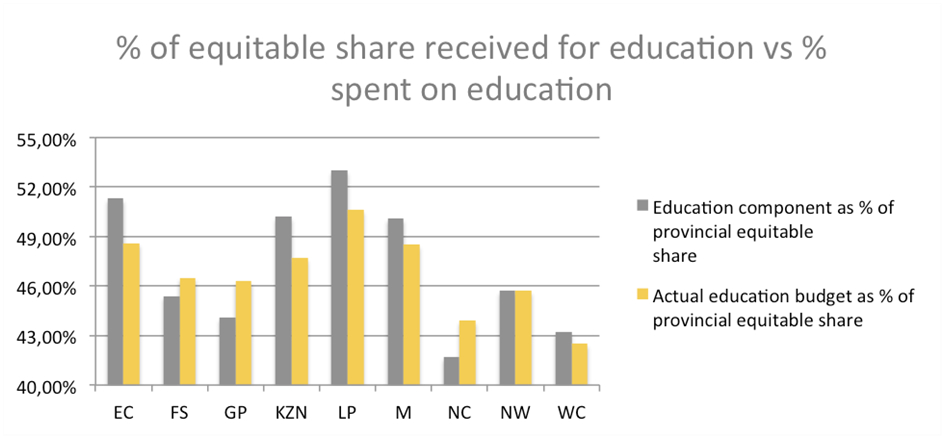
Sources: Estimates of Provincial Revenue and Expenditure for 2016; W1 Annexure to the Explanatory memorandum to the division of revenue, 2016
The (In)Equitable Share Formula
A focus on learner numbers alone is a crude way of allocating funding, which doesn’t consider the impact of historical inequalities and rurality on education costs. A closer look at the cost of the provision of education reveals why the equitable share formula is in fact inequitable.
The equitable share formula does not consider that the cost of providing education in rural areas is much higher than in urban areas. Delivering services and support can prove more costly and the lower population densities mean more schools are needed to provide education to the same number of learners. In 2016, for instance, learners enrolled in Eastern Cape schools made up 15.4% of national school enrolments. And yet the province was home to 23.1% of all schools in the country. In the same year Gauteng enrolments made up 16.6% of national enrolments, but schools in the province only amounted to 8.8% of all schools in the country. KwaZulu-Natal (KZN) had 37% more learners than Gauteng in 2016, but 180% more schools![4] Each school comes with its own costs (for instance a school principal) and therefore pushes up the cost of providing education. There is also a large and desperate demand for scholar transport in rural provinces, and meeting this need is substantially more expensive than in urban provinces. KZN has the greatest need for scholar transport in the country. The province has the highest proportion of learners in the country who walk to school, as well as the highest number of learners who walk to school for more than an hour (in one direction).
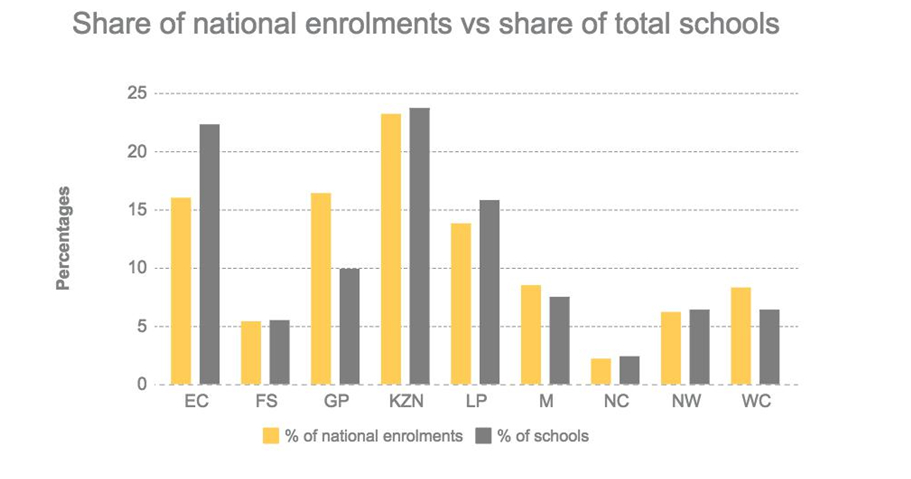
Source: Department of Basic Education, 2016 School Realities Report
The equitable share formula further fails to account for the impact of the apartheid legacy on the education realities of different provinces. Schools that catered exclusively for black learners prior to 1994 are historically underfunded, and provinces such as the Eastern Cape have large numbers of these schools.
The formula also does not consider the proportion of quintile 1, 2 and 3 schools in the province. The quintile system places all of South Africa’s ordinary public schools into five categories, based on poverty indicators of the school together with the relative poverty of the school’s catchment area. These indicators determine how much State funding a school receives. All quintile 1 to 3 schools are classified as no-fee schools, meaning that they are entirely dependent on financial support from the State. In quintile 4 and 5 schools the cost of education is shared with parents through the charging of school fees, and these schools have comparatively smaller infrastructure backlogs.
Poor provinces have a disproportionate amount of no-fee schools, which means the burden on State funding is more severe than in provinces with a higher number of quintile 5 schools. The equitable share formula fails to properly account for these disparities in education costs.
From the Apartheid era, South Africa inherited schools without adequate sanitation, lacking access to piped water or electricity, and built from inappropriate or dangerous materials such as wood, mud and asbestos. In rural provinces, learners as young as 5 years old, must walk punishing distances to reach schools in the desperate conditions described above. Therefore, in addition to national and provincial education budgets, Treasury also allocates funds to targeted grants, aiding the DBE in addressing these huge backlogs.
The Education Infrastructure Grant (EIG) and the Accelerated Schools Infrastructure Delivery Initiative are the two main school infrastructure grants. These are invaluable in ensuring that government complies with the law - the Minimum Uniform Norms and Standards for Public School Infrastructure (or, the Norms and Standards). The Norms and Standards prescribe the minimum infrastructural requirements for ordinary public schools, and set out legally-binding deadlines for when all schools must be provided with different kinds of infrastructure.
Yet despite this legal obligation, there has been a gradual decrease in the projected budget allocations to these programmes. For example, in 2013 the projected EIG allocation for 2015/16 was R10 billion, and yet by 2015, it had decreased to R9,5 billion. This has been the case for both EIG and ASIDI.
#FixOurSchools
The purpose of the EIG is to accelerate construction, maintenance, upgrading and rehabilitation of new and existing school infrastructure. This grant is understood to be the primary vehicle through which the DBE will meet the Norms and Standards. It consists of a base component that is distributed to all provinces, and a secondary component that allocates additional funding by means of a performance-based incentive approach[5].
The first Norms and Standards deadline required that schools without any access to water, electricity and sanitation be provided with these basic services, and that all schools built from inappropriate materials such as mud, wood, metal and asbestos be replaced[6]. This deadline dawned on 29 November 2016, and was not met by neither Minister Motshekga nor any of her nine MECs. This was an inexcusable violation of the law! The sluggish pace of implementation has repeatedly resulted in Treasury decreasing the allocations to both infrastructure programmes. Tragically, this perpetuates a cycle of ineffective provision that only serves to delay the fixing of schools.
Table 1: Total allocations to education infrastructure grant (EIG)
|
R'000 |
2014/15 |
2015/16 |
2016/17 |
2017/18 |
2018/19 |
|
2013 Budget |
7,160,699 |
10,059,320 |
|
|
|
|
2014 Budget |
6,928,908 |
9,469,408 |
10,037,961 |
|
|
|
2015 Budget |
|
9,517,555 |
9,773,692 |
10,330,562 |
|
|
2016 Budget |
|
|
9,613,692 |
12,780,435 |
13,511,560 |
Sources: National Treasury, 2011, 2012, 2013, 2014 Division of Revenue Act, 2015 Division of Revenue Bill
The table above shows the decreases in the EIG allocations. The left-hand column represents the year the budget was tabled, and the top row shows that year’s allocation and the projected allocations for the coming years. Note that the increase from R9.6 billion to R13.5 billion over the 2015-2018 midterm was not the allocation of new funds by Treasury, but rather the result of the merger of the EIG with ASIDI.
ASIDI, which is administered by national government, was introduced in 2011/12 to target the worst-off schools across the country, thereby easing the load of infrastructure backlogs for provinces with insufficient EIG funding.
ASIDI was initiated as a short-term programme that would fast-track the following:
- Improvement of sanitation in 741 schools
- Providing electricity to 916 schools
- Providing clean water to 1,120 schools
- Re-building 510 “inappropriate schools”
Due to to the DBE’s exceedingly slow pace of delivery, the budget allocations for ASIDI have gradually been decreased over the years, and this originally short-term programme has been extended to six years, with the possibility of further extensions.
Below are the previous years’ allocations to ASIDI:
Table 2: Total allocations to ASIDI: 2014/15 to 2018/19
|
R'000 |
2014/15 |
2015/16 |
2016/17 |
2017/18 |
2018/19 |
|
2013 Budget |
3,169,503 |
2,912,310 |
|
|
|
|
2014 Budget |
2,938,503 |
2,433,310 |
2,610,662 |
|
|
|
2015 Budget |
|
2,046,825 |
2,374,867 |
2,619,873 |
|
|
2016 Budget |
|
|
2,374,867 |
2,619,873 |
2,800,000 |
Sources: National Treasury, 2011, 2012, 2013, 2014, 2015 Division of Revenue Act, 2016 Division of Revenue Bill, Appendix W9 & p.85
In the same way that Treasury decreased the EIG’s mid-term allocations as a result of underspending by the PEDs, ASIDI has also seen a decrease in its allocations. Additionally, citing the programme’s “disappointing performance”[7], ASIDI has been merged with EIG as from this year onward.
Scholar Transport
EE remains deeply distressed that there is still no grant to fund scholar transport, despite provinces failing to budget adequately for this urgent need, when a startling number of learners must walk over 30 minutes get to school. The provision of effective transport for South African learners, for which we have been advocating since 2014, would address an immense but largely ignored barrier to access to education.
The punishing distances that learners must walk to schools leaves them exhausted and struggling to concentrate or stay awake in class. The severe lack of safe, reliable and affordable scholar transport contributes to late-coming and absenteeism — particularly when the weather is poor. En route to school, learners are vulnerable to theft and sexual assault.
According to the 2015 General Household Survey, a staggering 70% of the 14 million learners in South Africa walk to school every day[8]. This is not the figure which was (incorrectly) tabled by the national Department of Transport in their presentation of the National Learner Transport Policy in 2015[9]. If the departments responsible for scholar transport do not have accurate figures on how many learners need to be provided with transport to school, how can the implementation process of this policy be successful?
The funding toward scholar transport is decided by each individual province and allocated from their often insufficient Equitable Share. The 2016 Division of Revenue Bill set no funds aside to be used exclusively for scholar transport. This leaves the responsibility for allocating and managing funds to the PEDs, who have not budgeted according to the extent of the need for scholar transport. So long as there are no funds set aside exclusively for scholar transport, and the provisioning of scholar transport remains the responsibility of two departments that do not collaborate effectively with each other, learners will continue to walk these long distances to school.
This is why EE has called for a conditional grant to fund the proper and full implementation of the national Scholar Transport Policy. A conditional grant protects funds from being diverted towards other purposes. It also offers more clarity on the availability of funds, which will aid provinces in providing a more reliable and consistent service and aid the public in holding government accountable.
The Way Forward
EE and EELC have been advised that National Treasury is currently reviewing the equitable share formula. The process of review should be urgently prioritised and transparent, with public participation. This exercise must include an analysis of the cost differences of providing education in rural provinces, and the formula ought to be adjusted accordingly. Treasury should also either increase the weighting given to the poverty component of the formula or incorporate a poverty weighting in the education component. This would ensure that provinces with a higher share of poor schools and learners, receive a greater share of the funds, which is necessary to reduce inequality in education provision between provinces.
Early last year, EE and the EE Law Centre made submissions to Parliament’s Standing Committee on Appropriations on the Division of Revenue Bill 2016. The concerns that we raised were specific to the funding of school infrastructure, and of scholar transport. The submissions made by EE and EELC found resonance with the Committee, and it made recommendations to national Treasury including that:
National Treasury in partnership with the DBE, Department of Performance, Monitoring and Evaluation (DPME), civil society and relevant stakeholders in its programme on expenditure reviews include an assessment of the following:
- Efficacy of funding and a comprehensive evaluation of spending and implementation performance of the scholar transport programme and schools infrastructure programme.
- Exploring options that allow for the ring fencing of funding allocated to scholar transport to be used solely and exclusively for that purpose.
It was also recommended that:
- National Treasury in partnership with the DBE, DPME, civil society and relevant stakeholders develop systems to enhance monitoring and implementation effectiveness of the EIG. This should include adherence to the principles of openness and transparency in the planning and delivery of schools infrastructure.
- National Treasury in partnership with the DPME, and Statistics South Africa formulate and implement a programme at enhancing the quality and consistency of information and data utilised by provinces and municipalities in areas such as scholar transport, school infrastructure and other important policy areas.
We expect to know later today whether national Treasury has heeded this advice.
Equal Education acknowledges the quasi-federal system of government we have in the country, in which provinces determine how and where to spend the monies allocated by national Treasury. Nonetheless, there is nothing equitable about the equitable share formula - a formula which continues to enrich urban provinces and starves poor and more rural provinces. This is evident in the state of education facilities. We urge national Treasury and provincial departments of Treasury to lead the way in finding a more progressive and equitable way of sharing resources. Failure to do so will result in the large majority of our people - who reside in the periphery of urban centres - to remain in squalor, perpetuating poverty and the underdevelopment of rural provinces.
This is the task that we as South Africans have identified for ourselves as a people. With our painful past, we should not be fearful to stand up against those whose main aim is not only to delay us but to enrich themselves and their friends at the expense of the black majority whose only hope out of poverty is a functioning democratic State.
NOTES ON THE NATIONAL BUDGET PROCESS:
Provincial education departments bear the main responsibility for the day to day running of schools. They employ teachers, provide schools with the money to pay for a range of expenses from electricity to toilet paper, and fund expenses such as textbook provision. The DBE primarily (but not exclusively) plays an oversight role by formulating policy and taking responsibility for monitoring and evaluation.
In order to fulfil these responsibilities, PEDs and the DBE depend on the revenue allocated to them through the annual national budgetary process. Every year the central government decides on what is known as the vertical division of the budget:
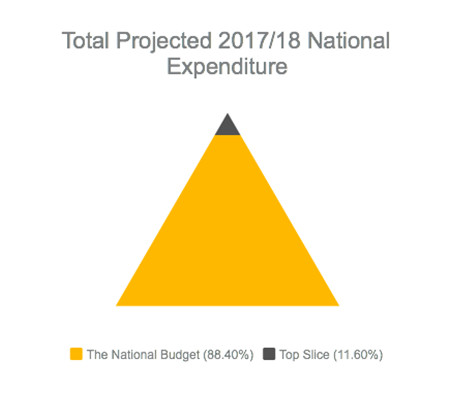
“Top slice”
First, an amount of the budget is set aside for things like repaying national debt, an emergency reserve and a fund for meeting certain policy priorities. This part is known as the top slice and does not get shared between different levels of government. The top slice is projected to make up 11.6% of the total national expenditure in the 2017/18 budget year.[10]
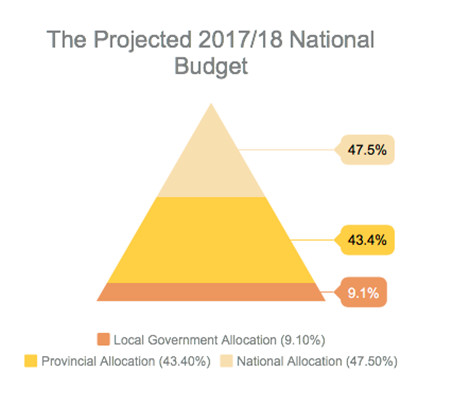
National, provincial and local government allocations
After the top slice has been set aside, a decision is made around the amounts that will be allocated to each sphere of government: national, provincial and local. The projected division for the 2017/18 year is: 47.5% of the national budget to national government, 43.4% to provincial governments and 9.1% to local government.[11] The national share includes conditional grants to provinces and local governments. Together all of these amounts make up the national budget.
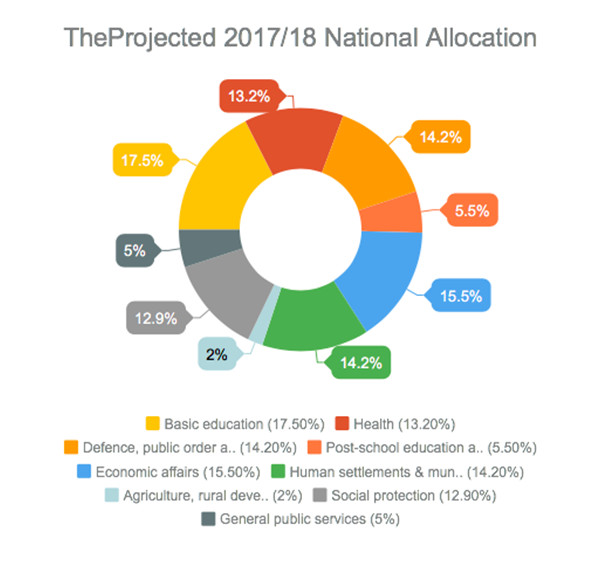
Once the vertical division has been finalised, the lump sum allocated to the national and provincial spheres of government is further divided. The national allocation is divided between sectors as follows:
Issued by Tshepo Motsepe, General Secretary, EE, 22 February 2017
Notes
[1] National Treasury, W1 Annexure to the Explanatory memorandum to the division of revenue, 2016.
[2] Birgit Weyss: "The impact of the Provincial Equitable Share Formula on School Funding", Unpublished research paper commissioned by the Equal Education Law Centre, 2016
[3] National Treasury, W1 Annexure to the Explanatory memorandum to the division of revenue, 2016.
[4] Department of Basic Education, 2016 School Realities Report
[5] National Treasury, 2016 Division of Revenue Bill, page 123
[6] National Department of Education, South African Schools Act 84 of 1996, Regulations relating to Minimum Uniform Norms and Standards for Public School Infrastructure.
[7] National Treasury, 2016 Division of Revenue Bill, page 84
[8] Stats SA, 2015 General Household Survey, page 14
[9] Equal Education, Submission to the Standing Committee on Appropriations on the 2016 Division of Revenue Bill, Page 14
[10] National Treasury, Medium Term Budget Policy Statement 2016
[11] National Treasury, Medium Term Budget Policy Statement 2016