
Election Outlook 2019
Ongoing and high-profile service delivery protests have been an important feature of the run-up to the National and Provincial elections on 8 May 2019. Moreover, uncertainty about which political party or parties to choose and diminished trust in political parties and political leaders have also made headlines.
29 April 2019
Ongoing and high-profile service delivery protests have been an important feature of the run-up to the National and Provincial elections on 8 May 2019. Moreover, uncertainty about which political party or parties to choose and diminished trust in political parties and political leaders have also made headlines. Ipsos and Africa Check hosted a function on the 25th April looking at the latest political opinion polls and unpacking the party manifestos ahead of the elections. This included representatives of the three biggest political parties in the country, a keynote speech by retired Judge Albie Sachs and presentations by AfricaCheck and Ipsos. Against this background this press release will focus on the pertinent issues highlighted by Ipsos.
Most of the results discussed are from a poll conducted from 22 March to 17 April 2019; the respondents were from all over the country and the sampling was done randomly. Interviews were conducted face-to-face in the homes and home languages of respondents. Results are filtered, weighted and projected to the final registration figures as noted and published by the IEC (Independent Electoral Commission).
Uncertainty
More than a third of those registered to vote on the IEC voters’ roll, indicated that there is no political party that represents their views. On the other side, 45% disagreed, in other words, they are certain of their political choice. Almost two in ten (18%) said that they neither agree nor disagree or chose the don’t know option.
THERE IS NO POLITICAL PARTY THAT REPRESENTS YOUR VIEWS
Disagree – 45
Agree – 37
The finding of 45% certainty is echoed in the results of another question – respondents were asked to indicate on a scale of 0 to 10 how convinced they are that they will actually vote for their chosen party on election day. According to these results, less than half of the supporters are strongly convinced that they will vote for their chosen party.
NOW, THINKING ABOUT THE POLITICAL PARTY THAT YOU CHOSE TO VOTE FOR – HOW CONVINCED ARE YOU THAT YOU WILL ACTUALLY VOTE FOR THIS PARTY ON ELECTION DAY
9 or 10 out of 10
ANC voters – 46
DA voters – 48
EFF voters - 47
Service delivery
Four in every ten registered voters believe that “It is quite acceptable to turn to protest such as strikes and marches if you are dissatisfied with the standard of services in your community”:
IT IS QUITE ACCEPTABLE TO PROTEST SUCH AS STRIKES AND MARCHES IF YOU ARE DISSATISFIED WITH THE STANDARD OF SERVICES IN YOUR COMMUNITY.
Disagree – 37
Agree – 42
(21% said that they neither agreed nor disagreed, or chose the don’t know option)
Moreover, almost the same proportion believe that “Violent protest is the only way to get service delivery”
VIOLENT PROTEST IS THE ONLY WAY TO GET SERVICE DELIVERY
Disagree – 42
Agree - 40
Clearly protest – and sometimes even violent protest – is seen as a legitimate way of political participation. On the other hand, communities who have not seen any development in the part 25 years can hardly be blamed if they use the opportunity to get attention from the media and even some attention from political parties and leaders.
Trust in parties and leaders
To create a simple index of the level of trust voters have in political parties, we subtract the proportion giving a negative answer from the proportion giving a positive answer to the question: “How much trust and confidence do you have in ……”
TRUST INDEX – own supporters
|
|
ANC |
DA |
EFF |
|
Nov. 2017 |
72 |
87 |
81 |
|
May 2018 |
78 |
85 |
89 |
|
Nov 2018 |
80 |
79 |
8282 |
|
Feb 2019 |
87 |
83 |
93 |
|
April 2019 |
85 |
87 |
93 |
It is clear from the slide above that the trust in all political parties are lower now than it had been in February this year. The trust index in the ANC came from a very low base in November 2017 (when Jacob Zuma was still president) to the current 29. Trust in both the DA and the EFF have been negative since we started this measurement. The low levels of trust in political parties are echoed by low levels of trust in political leaders.
TRUST INDEX – leaders
|
|
|
Cyril Ramaphosa |
Mmusi Maimane |
Julius Malema |
|
All registered voters |
Feb 2019 |
45 |
-31 |
-37 |
|
|
April 2019 |
40 |
-37 |
-44 |
|
|
|
|
|
|
|
Registered party supporters |
Feb 2019 |
83 |
77 |
86 |
|
|
April 2019 |
86 |
80 |
88 |
As can be seen, the levels of trust recorded in April in political leaders are also lower than in February, however, all three the leaders of the biggest political parties managed to increase the trust expressed in their leadership from their own supporters.
The ballot paper
Respondents registered to vote were given a ballot paper to make their own choices and imitate a “secret ballot”. Please see the bars below marked as “All registered voters April 2019” for the results of this question. However, this will mean that 100% of the 26,774.102 voters registered to vote will come out to vote on 8 May 2019. This will not be the case and therefore a scenario was developed using a possible voter turnout of 71% - as seen in the bars below marked “71% turnout scenario”.
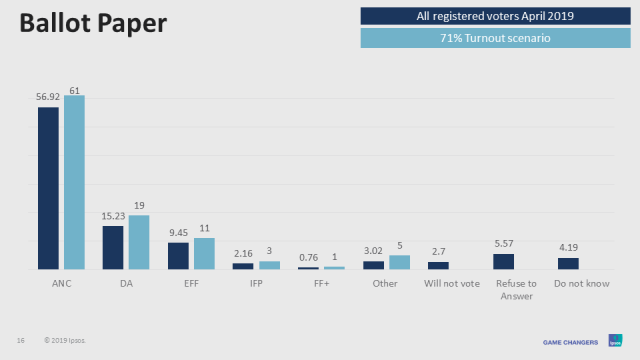
It has to be stated that more scenario development will be undertaken in the run-up to the election. The possible results cannot be cast in stone, as issues like the increase in the petrol price, the last public campaigns and also the (controversial) opinions expressed during these last week by political leaders can also influence results.
TECHNICAL DETAIL
Fieldwork: 22 March – 17 April 2019
3600 in-home F2F interviews. Conducted in home languages of randomly selected respondents.
Countrywide representation
Filtered results by 18 and older AND registered to vote.
Results weighted and projected to official published IEC registration figures
Margin of error for this subsample (0.9% - 2%) – based on sample size, response rate and sampling methodology.
Issued by Ipsos, 29 April 2019