This analysis will look at the demographic profile of party support for the “big five” political parties, for the 2024 national election: The African National Congress (40.18%), the Democratic Alliance (20.81%), uMkhonto Wesizwe (14.58%), the Economic Freedom Fighters (9.52%) and the Inkhatha Freedom Party (3.85%).
It will cover the following demographic indicators, in this order:
Age
Employment Status
Monthly Household Income
Residential Area
Population Group
Education Level
First Language
Province
Gender
Methodology
All these numbers are drawn from the consolidated SRF track, which ran from 15 April – 27 May 2024, with a representative sample size of 7,196 registered voters and a margin of error of 1.16%. The national ballot question was used (that is, baseline support – if turnout was 100%).
There are various ways to construct this data, one can go into great depth by cross-referencing categories. For example, how strong is EFF support among women with a university degree in urban centres? However, this study focuses on the top-line findings for each core indicator, as the work involved in anything more complex is beyond the capacity of this author.
Summaries
For those primarily interested in the top-line findings only, below is a summary slide for each party, with every indicator. A more detailed, comparative analysis of each indicator follows bellow them
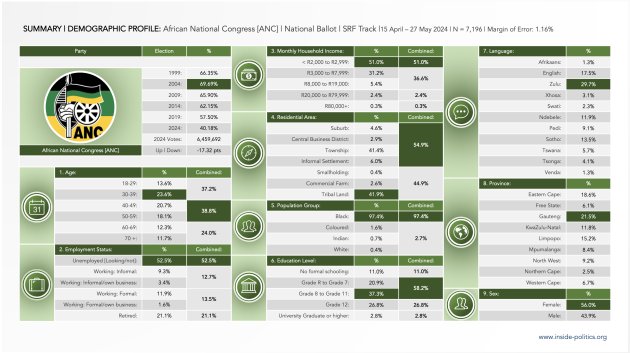
a. African National Congress (ANC)
b. Democratic Alliance (DA)

c. uMkhonto Wesizwe (MK)

d. Economic Freedom Fighters (EFF)

e. Inkhatha Freedom Party (IFP)

1. Age
Below is a set of charts that compare the age profile of each party’s support by age.

For the sake of analysis, the table below the charts consolidates the age cohorts into three more helpful brackets: “young” (18-39), “middle-aged” (40-59) and “old” (60-70+). Both MK and EFF stand out as having disproportionately more young support (57.4% and 61.6% of their support is between 18 and 39 respectively). The DA has disproportionally more “older” support (23.5%) than other parties. These disparities are better illustrated in the graph below, which includes the IEC numbers by age cohort for comparative purposes:

The dark blue dotted line represents the official age breakdown of registered voters by age cohort. You can see how MK and the EFF exceed the line in the 18-29 and 30-39 cohorts, and how the DA exceeds the line in the 70+ cohort. The DA is also significantly below the line in the 18-29 cohort, and the EFF significantly below the line in the 60-70 cohort.
Here are the same numbers condensed into “young”, “middle-aged” and “old”, as a bar graph:

Parties like the ANC and IFP tend to mirror the IEC average. The DA, MK and the EFF buck the trend – the DA by having a relatively older support base, MK and the EFF by having a relatively younger support base.
2. Employment Status
Again, let us start with a comparison of all five parties side-by-side:

If we consolidated those numbers into “unemployed” and “employed”, the DA’s support base stands out as significantly more weighted towards “employed” (49.1%) and the ANC, MK, EFF and IFP towards “unemployed” (52.5%, 60.4% and 56.6% and 64.8%). The DA also has a significantly higher proportion of “retired” voters (30.4%) which aligns with its generally older age profile. The IFP has the biggest proportion of “unemployed” support (64.8%) underpinned, significantly, by the biggest proportion of voters who identified as “unemployed and no longer looking for work” (20.3%).
Here are those numbers as a bar graph:

Apart from the relatively high proportion of “unemployed” ANC, EFF, MK and IFP voters, and the relatively high proportion of “employed” DA voters, it worth noting the difference in the informal and formal sectors for all five parties (the EFF is particularly interesting here, with twice the number of voters in the formal as opposed to informal sector) and the low number of people in the informal and former sector who have their own businesses. It would be interesting to know how many of those people who are employed work in the public and private sector respectively, but unfortunately the SRF survey did not cover that.
Finally, those initial groups – “unemployed”, “employed” and “retired” – as a bar graph:

This demonstrates how DA support is weighted towards the “employed” (although 20% of DA voters are “unemployed”, 1 in 5, which is not insignificant).
3. Average Monthly Household Income
Here are all five parties side-by-side:

The DA has the highest proportion of higher income earners. 69.3% of its support is made up of voters with an average household income of R20,000 or more. The ANC, MK, EFF and IFP have a larger proportion of lower income voters, with 51% of ANC voters having a household income of R2,999 or less per month, MK 41.3%, the EFF 37% and the IFP 51.8%. There is more parity with regards the “middling” R3,000 to R19,999 bracket.
(These numbers don’t add up to 100% because around 10% of respondents refuse to answer this question or say they don’t know).
Here are all individual categories as a bar graph:

The difference between DA and ANC/MK/EFF/IFP support is well illustrated.
And here are those numbers grouped:

While the trend-lines for the ANC/MK/EFF/IFP all tend downwards, towards the higher income brackets, the DA’s trend-line tends upwards marginally, although this again is relative (28.2% of the DA’s support – 1 in 3 DA voters – comes from voters with an average monthly household income of R4,999 or less).
4. Residential Area
All five parties side-by-side:

Again there is a significant difference between the DA and the ANC/MK/EFF/IFP. Whereas 86.8% of DA voters come from urban residential areas, 54.9%, 53.4%, 65.2% and 37.4% of support for the other parties come from urban centres as well. Within the other four, the EFF (65.2% urban) and the IFP (62.7% rural) are the noticeable outliers. MK is distinctive in having the most even balance between urban (53.4%) and rural (46.7%) voters.
Here is the same breakdown in the form of a bar chart:

Within urban areas, the bulk of the DA’s support comes from the suburbs (54.2%), although it does relatively well, given its support by population group, in Townships (16.2%). In turn, Townships are where the bulk of ANC/MK/EFF support comes from in urban centres. With regard to rural areas, an incredibly small number of people actually live on small holdings and commercial farms, so all parties have a small proportion of support there. The bulk of rural support comes from tribal land, where the IFP dominates (59%) and the ANC/MK/EFF fair well.
Returning to the hard urban/rural distinction, here are those numbers in the form of a bar graph:

The fundamentally different shape of the DA trend-line demonstrates its reliance on urban support.
5. Population Group
There is an extensive deep-dive analysis of this indicator elsewhere on Inside Politics, so it will not be dealt with here. If you wish to read that analysis, click here.
6. Education Level

All parties have a significant amount of support from voters with low education levels (69.2% of ANC voters have Grade 11 or less; DA 32.9%, MK 56.6%, EFF 45.1% and IFP 61.9%). The ANC’s has the biggest proportion of support among voters with no formal schooling (11%), and the DA the biggest proportion of support among voters with a university degree or higher (24.8%). The DA and the EFF have the biggest proportion of voters with Grade 12 (41.2% and 42.4% respectively). Here are all categories in the form of a bar graph:

The disproportionate number of ANC and IFP voters with Grade 7 or less (31.7% and 23.8%) and the disproportionate number of DA voters with a university degree or higher stands out as significant. If we group the categories slightly differently, as per the below, we can see how heavily weighted all party support is towards the category Grade R to Grade 11.

7. First Language

First language is one of the easier indicators to map, and there is little point in grouping languages. The standout features are fairly self evident: A large proportion of DA voters speak English (38.5%) and Afrikaans (43.4%) and the bulk of both MK and IFP voters are primarily Zulu-speaking (78.3% and 80.5%), a natural consequence of the fact that both parties are primarily regional and draw the overwhelming bulk of their support from KwaZulu-Natal.
8. Province
We can group provinces, but it is a subjective call. With the exception of Gauteng, all provinces have a rural and urban component. However, for the sake of argument, there is a case to made that the three provinces with the biggest urban centres – the Western Cape (Cape Town), Gauteng (Johannesburg, Tshwane, Ekurhuleni) and KwaZulu-Natal (Ethekwini) – can be grouped together. If we do that, we get the following patterns:

KwaZulu-Natal perhaps skews the results for MK and the IFP (both of who primarily draw their support from that province), but there are helpful insights for the other three, more national parties. The ANC’s support is primarily rural (60%), the DA’s support primarily urban (70.5%) and the EFF most balanced between the two (45% urban, 54.9% rural).
If we look at each province individually, and include the official IEC registration number per province, by way of comparison, we get the following bar graph:

MK and the IFP are obviously heavily reliant on KwaZulu-Natal and the DA on the Western Cape. The 2024 election saw the ANC’s vote share in KwaZulu-Natal decimated; in turn the percentage of ANC support drawn from KwaZulu-Natal has fallen to 11.8% meaning it now draws a smaller percentage of its total support from that province than the DA, MK and IFP do and is almost on par with the EFF. It is also significantly below the IEC totals for that province.
Interestingly, in Gauteng (South Africa’s most populous province) support for all parties is fairly evenly distributed.
Returning to the grouped provinces, as a bar graph it looks like this:

9. Gender
Finally, gender. Here is each party side-by-side:
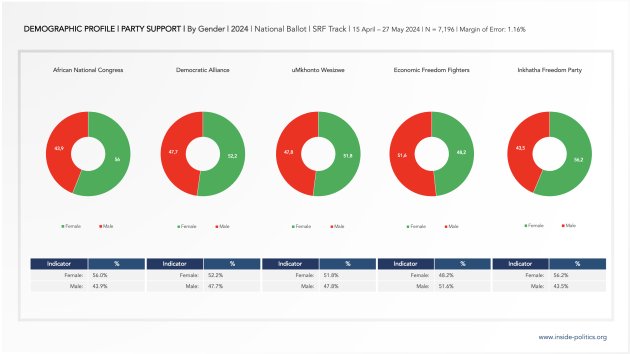
With the exception of the EFF (51.6% male), all parties have greater support among women than men. This aligns with the nature of the voters roll, which demonstrates that women are generally registered in a greater proportion than men (55.3%). If we include the IEC numbers in a bar graph, we get the following:
Closing thoughts on the DA
Among the “big five”, and in general terms, the DA’s support profile is distinct, and so it is worth focusing on. In turn, it is the most complicated.
One could argue – again in general terms – that parties like the ANC/MK/EFF/IFP, have similar constituencies. They are younger, more likely to be unemployed, have a lower education profile, live in Townships or on Tribal land and have a lower income profile. In hard political terms, that makes for a constituency relatively easier to identify.
While the DA is often slightly weighted in the other direction, and for all the criticism it gets as elitist, it has the most diverse profile, with a significant amount of its support that meets the very characteristics set out above.
30% of DA support (1 in 3 DA voters) are aged 18-39
20% of DA support (1 in 5) is unemployed
33% of DA support (1 in 3) has Grade 11 or less
30% of DA support (1 in 3) has a monthly household income of less than R20,000
24% of DA supporters (1 in 4) live in Townships or on Tribal land.
But it has to balance that constituency – roughly a third of all its support – with the following:
35% of DA support (1 in 3 DA voters) are aged 60+
49% of DA support (1 in 2) is unemployed
25% of DA support (1 in 4) has a university degree or higher
20% of DA support (1 in 5) has a monthly household income of less than R5,000
54% of DA supporters (1 in 2) live in Suburbs
And that is before you look at the “middle ground” – those DA voters who fall between these two extremes, which also constitute roughly a third of the DA’s support.
Compare that complexity to the MK, for example:
78% of MK support (4 in 5 MK voters) are aged 49 or less
60% of MK support (2 in 3) is unemployed
57% of MK support (2 in 3) has Grade 11 or less
67% of MK support (2 in 3) has a monthly household income of less than R20,000
80% of MK supporters (4 in 5) live in Townships or on Tribal land (or 61% from KwaZulu-Natal).
MK support is simply more homogeneous, in terms of core demographics indicators. The same is true of the ANC/EFF/IFP to a large degree.
The DA is relentlessly pigeon-holed, both in racial terms, and in terms of its constituency (white, rich), when in truth it boasts the most diverse support in both respects. No party appeals to, draws from or promotes the interests of such a broad support base. And no party gets more misrepresented or maligned in terms of its intent.
Were the DA to ignore any one element of its market – from the unemployed, to the working, middle and upper income classes – its support would be decimated by around 30%. That is a sum most parties do not have to do, and given how complicated and divided South Africa is, it a modern miracle it has been able to do it at all. Certainly it stands alone on this front, among all parties with a meaningful support base.
This essay is the 16th in an on-going series on Election 2024, for all other editions of this series, please click here: Election 2024